Les Nemethy
Euro-Phoenix Ltd
CEO of Euro-Phoenix (europhoenix.com), a Central European corporate finance firm,...
Figure 1: Total Global Debt as a Percentage of Global GDP [3]
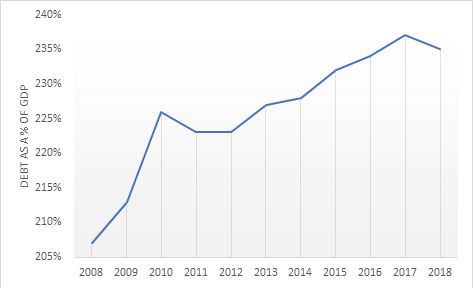
One of the most basic principles of finance is that leverage is always correlated to risk. Hence systemic risk in the global financial system is considerably higher today than it was in 2008. That’s not to say that a recession or depression will happen tomorrow. But it does mean that the global economy is less able to withstand a shock, should one arise.
Financial shocks can come from unexpected places. In 2008, the financial shock came from subprime debt. It was like the spark that set off the tinder keg. Before 2008, most people hadn’t heard of subprime debt, and to the best of my knowledge, no economist had predicted that this could trigger a financial crisis.
It is not possible to predict the origin of the next financial crisis. It might be triggered by the current trade war, loss of confidence in a particular government, a war, the failure of a financial institution, or a combination of the above. Or it might come from a totally unexpected source. Whatever the source of the shock, the higher the levels of debt, the more likely that there will be conflagration and contagion.
Because conflagration and contagion are more likely to occur at those pressure points of the global economy where debt levels are highest, for the remainder of this article I will focus on breaking down global debt, to identify places where risk is greatest.
As the following chart shows, corporate debt increased the fastest (from 79 percent to 92 percent of global GDP), while government debt also grew healthily (from 62 percent to 84 percent), from 2008 to 2018. Only household debt was moderate (66 percent to 59 percent) over the same period [4].
Figure 2: Global debt as a percentage of GDP since 2008 [5]
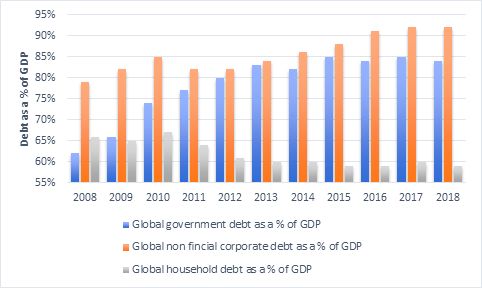
And yet, in 2008, the general conclusion was that debt levels were way too high and should be paid down in order to make the world a more stable place. Instead, governments and corporations have continued to pile on debt. They have not learned their lesson from 2008. We’ll now examine government, corporate and household debt in more detail.
(a) Government debt
As the chart below demonstrates, it is the Japanese and Chinese Governments that have piled on the most debt, although Chinese debt levels started from a much lower base in 2008:
Figure 3: Comparison between 2008 and 2018 government debt as a percentage of GDP [6]
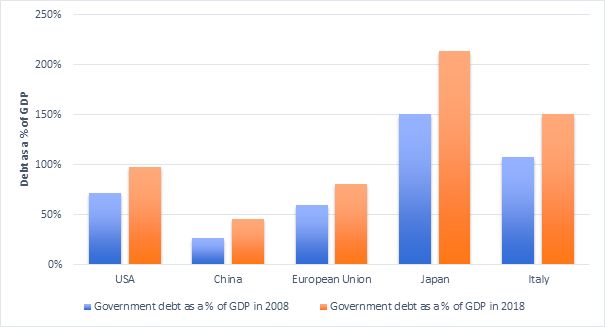
You might say that a government can never go bankrupt – they can always print more money. But a government may default where debt is denominated in foreign currencies. The more likely scenario is that in the event of a crisis, governments will need to pay significantly higher interest rates to sell bonds. The US Government currently pays about 8 percent of its budget to service debt [7], and this is with extremely low interest rates. What if the US Government had to triple its cost of servicing treasuries during a recession, when tax revenues are falling? Ouch!
(b) Corporate debt
Again, here China has been among the most profligate, with the European Union also showing healthy increases in debt:
Figure 4: Comparison between 2008 and 2018 non-financial corporate debt as a percentage of GDP [8]

It should be borne in mind that the Chinese economy has been the fastest growing major economy in the world – more than doubling over the 2008-2018 period – to become the largest economy in the world on a Purchasing Power Parity basis, so the fact that Chinese corporate debt has increased by over 50 percent relative to GDP points to a truly staggering level of debt growth with Chinese corporations. This is particularly worrying where state-owned banks are lending to state-owned corporations, as well as lightly regulated non-bank financial institutions accounting for so much lending.
Much of corporate bonds are low grade: the BBB bond market in the US has exploded as it represented nearly 50 percent of the total corporate bond market in September 2018, versus 35 percent in 2006 [9].
According to Fitch Ratings, $500 billion of US bonds are just one downgrade away from junk bonds. If downgraded, this would create major losses for investors, potentially creating a vicious circle of investors withdrawing funds from the bond market, further driving up interest rates, etc.
c) Household debt
Household debt has generally been decreasing in most economies of the world – with the dramatic exception of China (which, once again, started with a relatively low base in 2008).
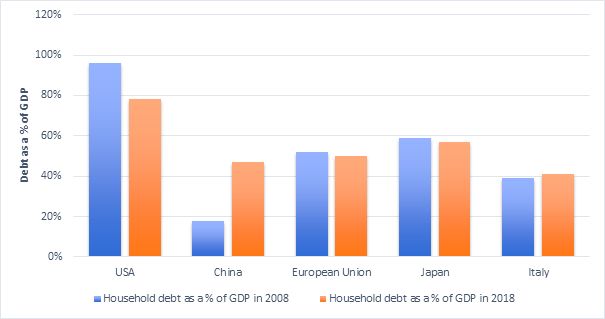
Figure 5: Comparison between 2008 and 2018 household debt as a percentage of GDP [10]
Nevertheless, there are certain segments of household debt that still provide cause for concern. For example, student loans represent roughly $1.5 trillion in the US [11] and have more than doubled since 2008. It is now the second-largest category of outstanding consumer debt (after mortgages), and every year more than a million people default on their student loans, and approximately 40 percent of borrowers are expected to default on their student loans by 2023 [12].
In conclusion, it seems that most governments and corporations have not learned their lesson from the 2008 financial crisis (perhaps most households have). This creates a virtual certainty that there will be another financial crisis – the only question is when – and it also raises the question as to whether the next recession could be more severe than the one in 2008.
[1] Institute of International Finance (IIF)
[2] Institute of International Finance (IIF)
[3] McKinsey Global Institute – Visualizing global debt
[4] McKinsey Global Institute – Visualizing global debt
[5] McKinsey Global Institute – Visualizing global debt
[6] McKinsey Global Institute – Visualizing global debt
[7] https://www.thebalance.com/u-s-federal-budget-breakdown-3305789
[8] McKinsey Global Institute – Visualizing global debt
[9] https://tortoiseadvisors.com/mc/attachments/512/Market%20Insight_The%20Storm%20Surrounding%20BBB%20Rated%20Corp%20Credit.pdf
[10] McKinsey Global Institute – Visualizing global debt
[11] According to the Federal Reserve
[12] According to the US Department of Education and studies of Judith Scott-Clayton, Associate Professor at Columbia University