Poland compared to Europe
According to preliminary data of the Leaseurope federation, the dynamics of the European leasing industry as at the end of 2017 amounted to +9.5%1 y/y. Against this backdrop, the Polish leasing sector has been growing at an observably higher rate. Annual average dynamics of the European leasing market in the years 2013-2017 amounted to +7.2%2.Having compared these data with the data of the Polish Leasing Association, one may conclude that in 2017 the Polish leasing sector grew by +15.7 percent, whereas the annual average dynamics for the Polish leasing sector in the last 5 years amounted to +17.7 percent.
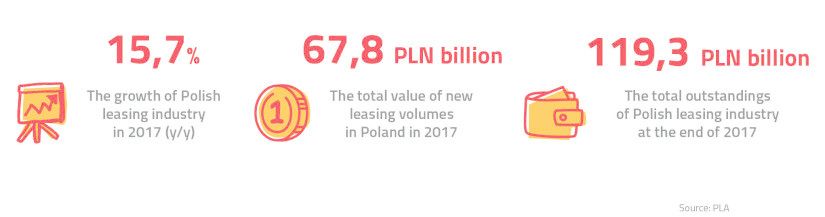
The dynamics of the Polish market is considerably higher than the growth observed by the whole European sector. In the last 12 months, the share of the Polish leasing industry in the European market went up from 4.4 to 4.8 percent. While in 2016 the leasing industry financed investments of Polish companies worth PLN 58.6 billion, in 2017 the corresponding rate was as high as PLN 67.8 billion. At the end of 2018, total financing provided by the Polish leasing industry may exceed PLN 83 billion (in the case of the assumed market dynamics reaching the level of 23 percent). Thus, 2018 will be the sixth consecutive year marked by a double-digit growth pace. The role of leasing in the creation of the GDP has been ever more important over recent years. At the end of 2017, the share of the leasing industry in the GDP accounted for 3.4% - twice as high as the EU average rate and higher than in countries with much more mature leasing markets and developed economy such as Great Britain, Germany, France or Spain.
Table 1: Polish leasing market in 2017, Source: PLA.
 Sources of SME financing
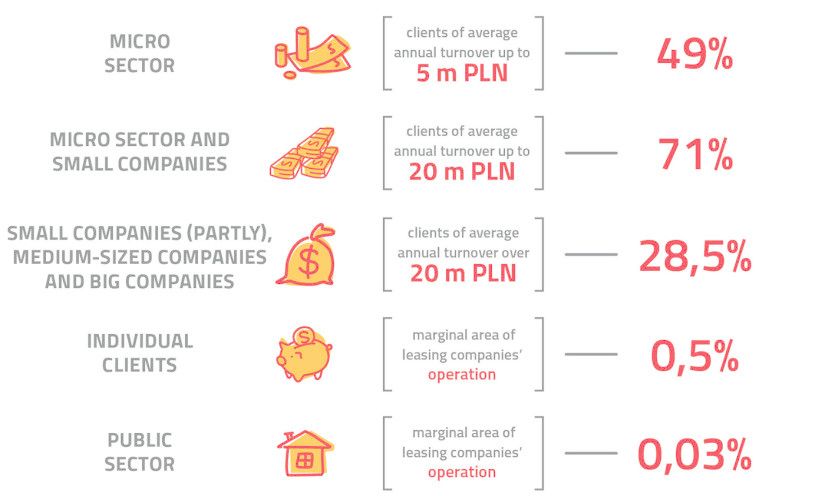
A study conducted by SAFE published by the European Commission has shown that 60% of company owners from the SME sector declare the intention to use leasing. This is the third highest result in Europe, while the respective average rate for Europe is 48%. For Polish entrepreneurs from this industry, leasing is the most significant source of investment financing. According to the estimates of the Polish Leasing Association, the largest group of leasing customers, accounting for about 71%, are customers with turnover up to PLN 20 million. This group includes micro-businesses and small enterprises. 28.5% are customers whose turnover exceeds PLN 20 million, whereas individual clients make up 0.5%. In the public sector, the use of this form of financing is at a marginal level.
Table 2: Assets financed by the leasing companies – according to annual turnover criteria (estimation), Source: PLA.
 Customers of leasing companies
40% of small enterprises have used leasing services, whereby 81% of leasing customers are satisfied with that form of financing3. Such conclusions can be drawn from a study performed by CBM INDICATOR based on a Poland-wide sample of companies with a turnover rate no higher than PLN 5 million. According to the respondents, the most
crucial factors considered when choosing a leasing company included: price rates (73% believed that the price played a big or a very big role), openness for negotiation (69%) and a quick decision- making process (67%).
Table 3: The structure of the Polish leasing market - late 2017, Source: PLA.
Market structure and results for individual product categories
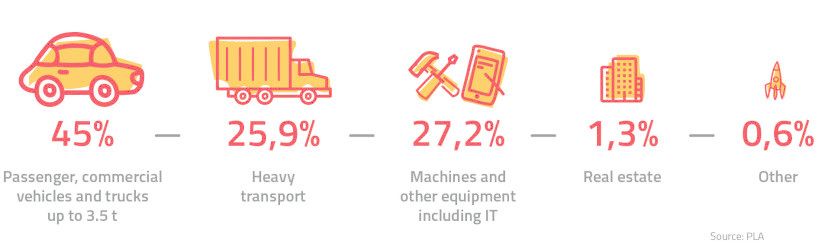
In 2017, the customers of leasing companies would typically purchase passenger and commercial vehicles and trucks up to 3.5 tones (45 percent share in the market structure), machines and other equipment including IT (27.2 percent) as well as heavy transport (25.9 percent). Other transactions included real estate (1.3%) and financing other assets (0.6%).
Assets financed by the leasing industry in 2017
2017 was marked by a revival of three major market categories, i.e.: passenger and commercial vehicles and trucks up to 3.5t (+21.9 percent of dynamics y/y), machines and other equipment including IT (+20.4 percent of dynamics y/y) and real estate (+26.5 percent of dynamics y/y).